Analysing Incidents and Stations
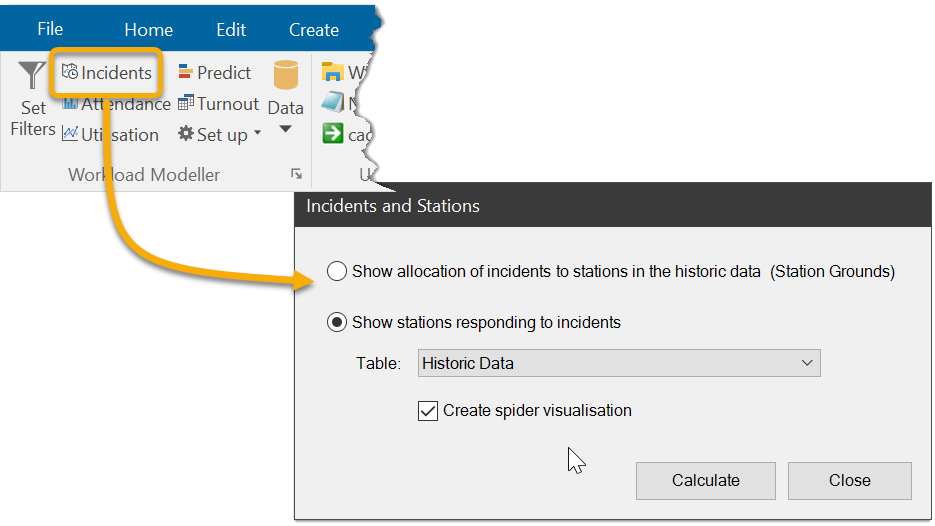
Click  on the Workload Modeller toolbar to see analysis options.
1. Show allocation of incidents to stations in the historic data (Station Grounds)
This analysis can ONLY be run on historic data.
It reports the number of incidents assigned to each station (i.e. it is based on the data loaded from Incidents.txt.)
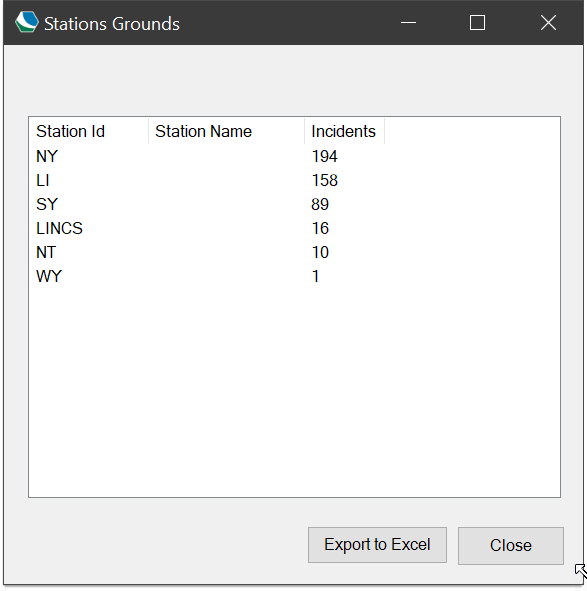
An example of the on-screen output is shown below. The results are listed in numerically descending order.
Here station NY was assigned 194 of the incidents in the data being analysed; LI was assigned 158 etc.
Click Export to Excel to create an Excel workbook for this output.
The workbook contains:
- A title page which includes the filter definitions.
- A spreadsheet of the numbers as they appear in the on-screen output.
- A sheet with a bar chart of the data, the chart includes data labels.

2. Show stations responding to incidents
This analysis can be undertaken on historic data or the output of a model.
It reports the number of callouts responded to by each station, i.e. for the historic data this is based on the data loaded from Callsigns.txt.
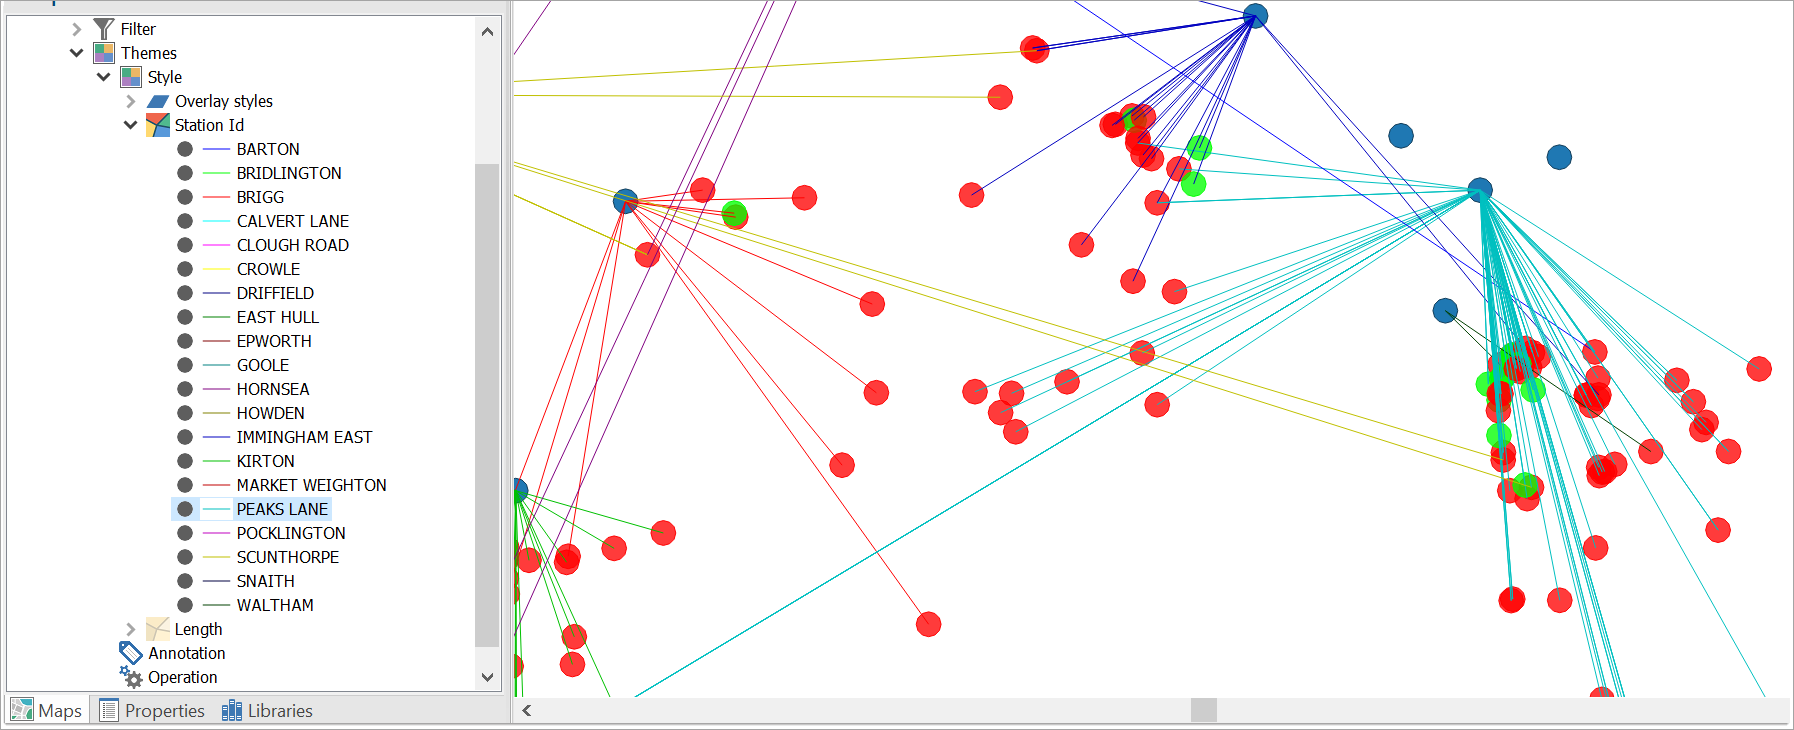
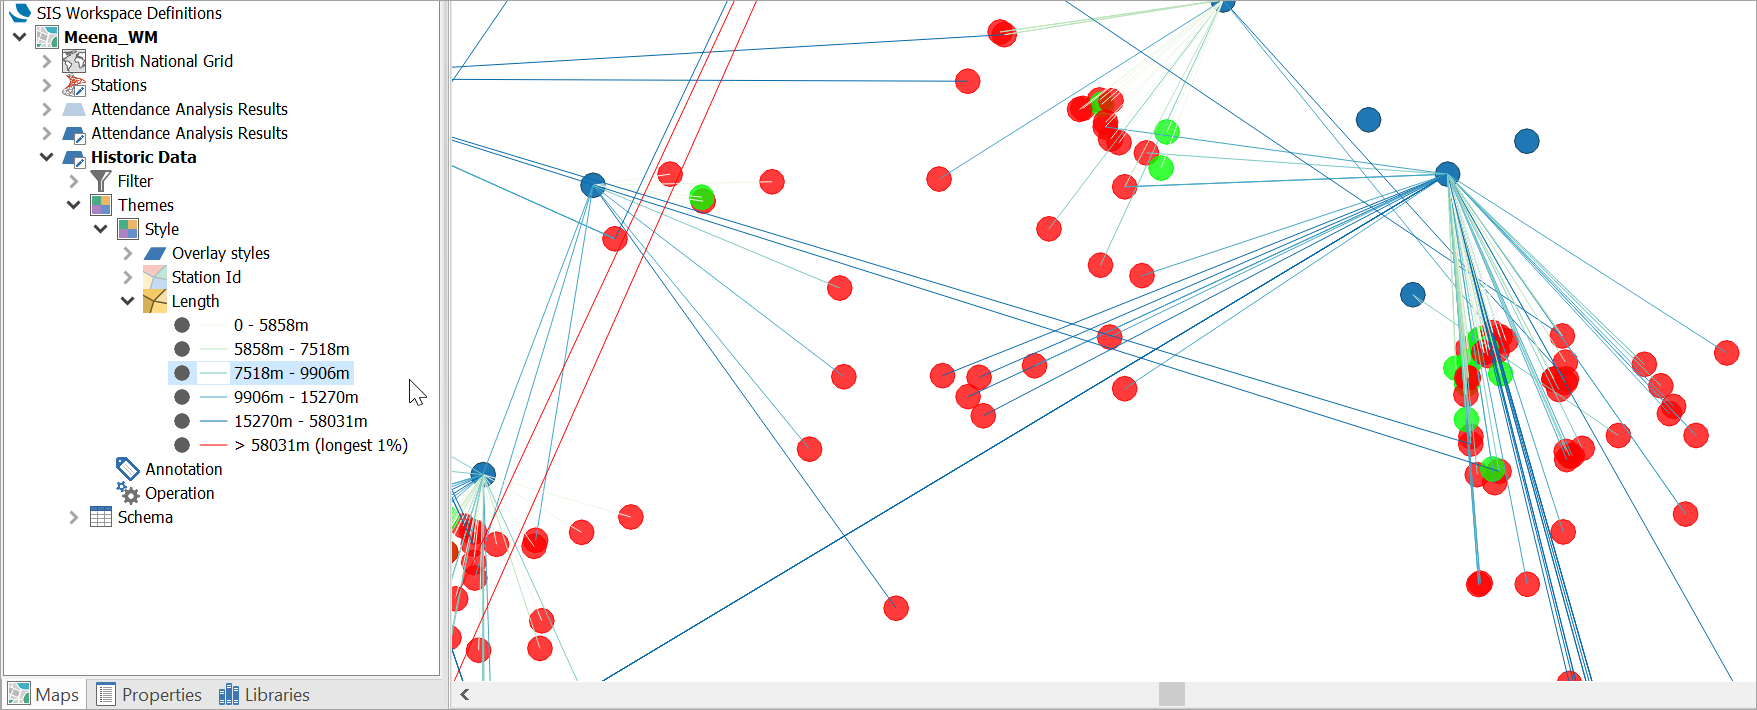
Create spider visualisation creates a graphic showing the callouts responded to by each station.
Note: see Examples of spider visualisation below.
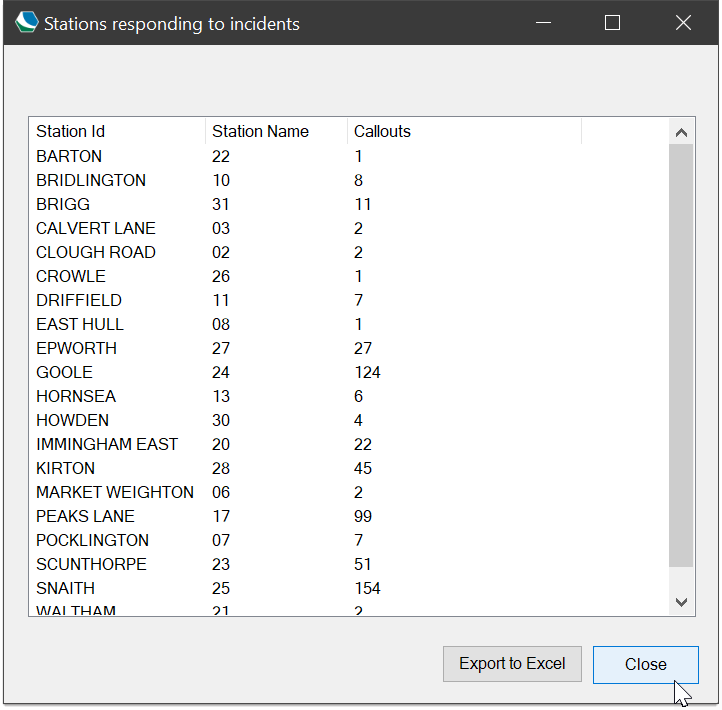
The results are listed in Station Id alphanumeric order.
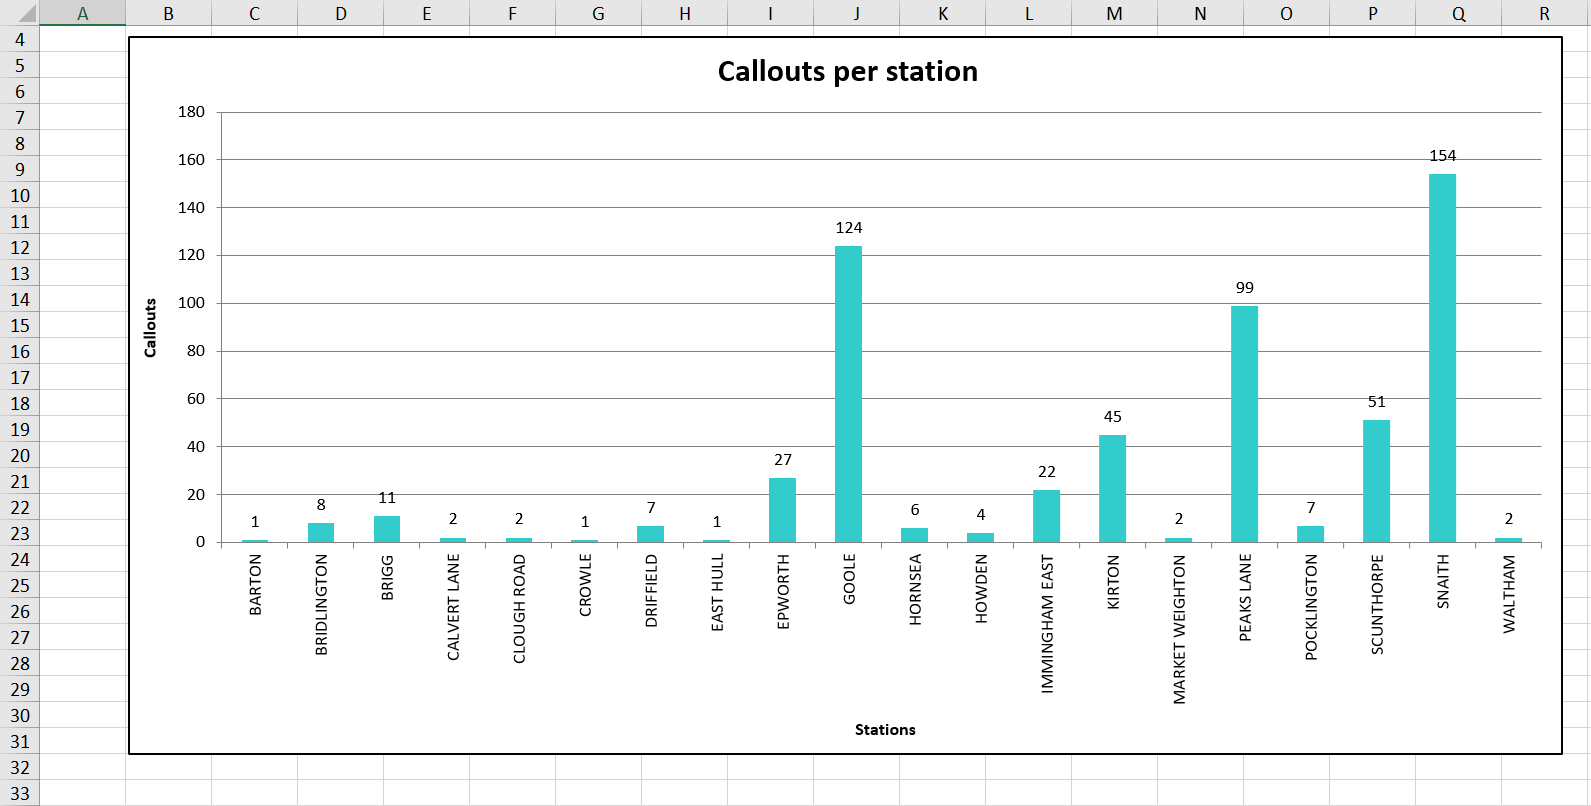
The above output shows that Goole responded to 124 callouts in the data being analysed; Peaks Lane responded to 99 callouts and so on.
Click Export to Excel to create an Excel workbook for this output. This contains:
- A title page which includes the filter definitions.
- A spreadsheet of the numbers as they appear in the on-screen output.
- A sheet with a bar chart of the data.
Examples of spider visualisation.
Callouts responded to by Station Id Peaks Lane:
Callouts of Length 7518m- 9906m:
